Prediction run 1
Models description
| ModelID | Description | JobID | Dataset | Img arg | bs | epoch |
|---|---|---|---|---|---|---|
| 1 | fastai_06py_alltrains.pkl | 45186392 | SewerML_alltrains(80/20) | Resize(224, squish) | 256 | 50 |
| 2 | fastai_sample_00_v2.pkl | 45965733 | SewerML_sample_00_v2 | Resize(712) | 32 | 5 |
| 3 | fastai_sewerml_train_val_356_239.pkl | 46585270 | SewerML_Train_Val | Resize(356) | 128 | 10 |
| 4 | fastai_sewerml_712_418_32_10_SewerML_Train_v1.pkl | 46584861 | SewerML_alltrains(80/20) | Resize(712) | 32 | 10 |
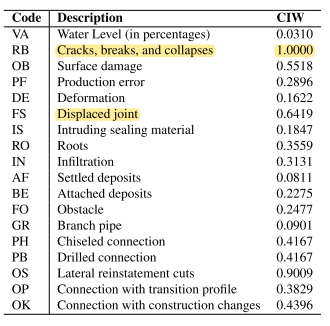
Sewer-ML defect/observation code
Prediction script on SANMN00893_1 dataset (1008 images) using model 4
From Access dataset, the SANMN00893_1 (InspectionID = 2) has 6 PACP code:
- AMH Access Point Manhole
- MWL Miscellaneous Water Level (VA)
- RFL Roots Fine Lateral (RO)
- TB Tap Break-in/Hammer (GR, PH, PB, OS, OP, OK are related to connection pipes)
- TBB Tap Break-in Abandoned (GR, PH, PB, OS, OP, OK are related to connection pipes)
- SSS Surface Damage Surface Spalling (OB)
There were mistakes in an assess dataset. ConditionID 9 - RFL should be at distance 14m and not 0.0m. The annotation in the video was correct.
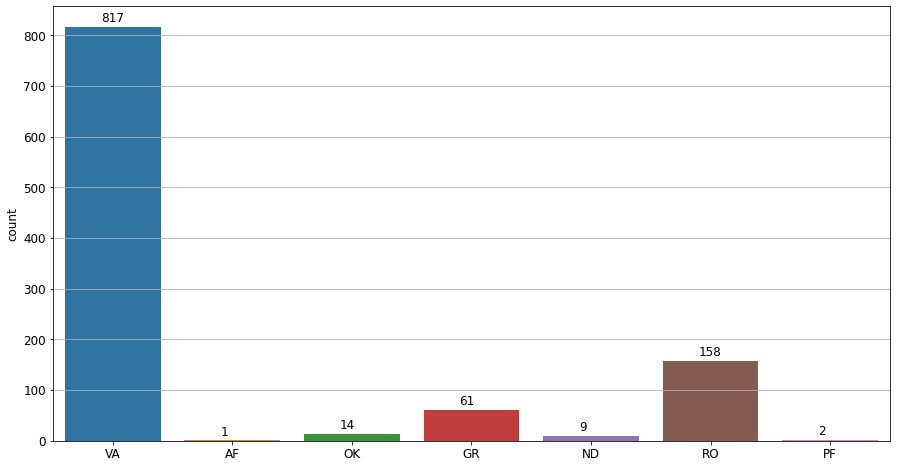
Predicted label distribution when threshold is set to 0.5
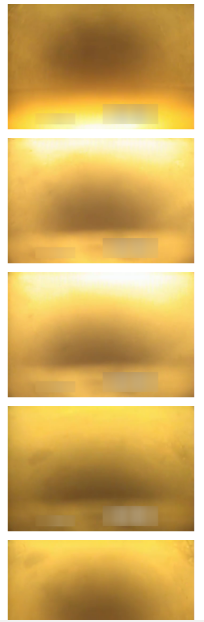
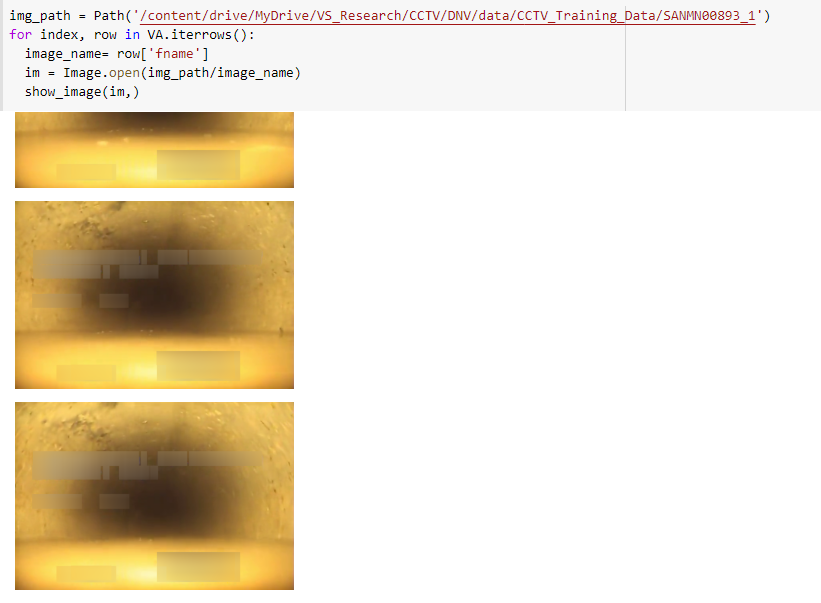
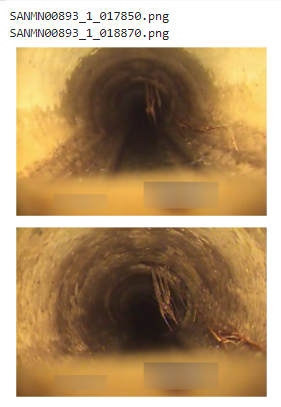
- 72 images had no label. Sample images:
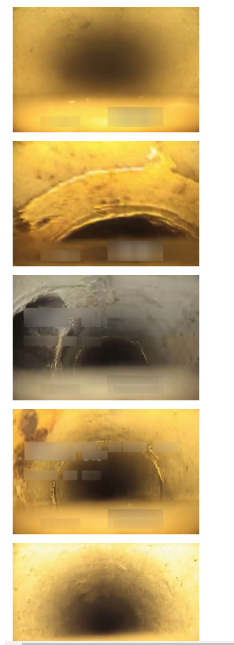
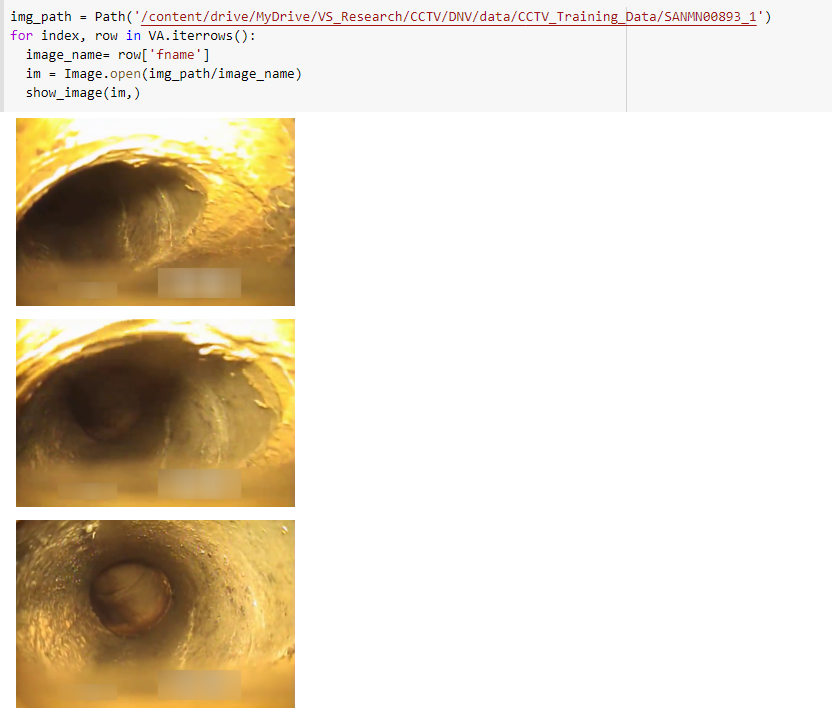
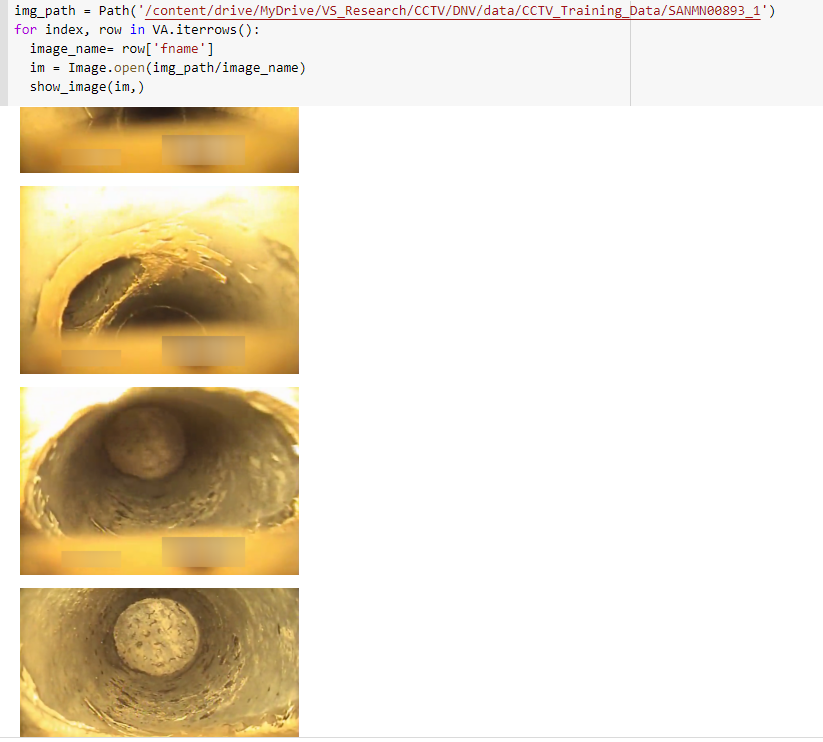
- 817 images were identified as VA (water level). The equivalent code to VA in the PACP standard is MWL. For Danish standard, the water level is only logged at the beginning and end of the inspection or where there is big difference in water level (more than 10% step interval). In SANMN00893_1 video, MWL were logged in four places: i) 0m (5%), ii) 3.1m (40%), iii) 6.9m (20%), and iv) 14.2m (5%)
- Sample images of correctly identified water level images
- Sample images of incorrectly identified water level images
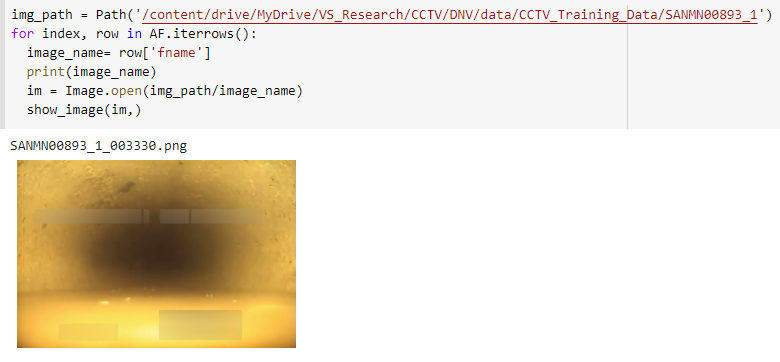
- 1 images were identified as AF (Settled Deposit). The image should be labeled as ND and VA.
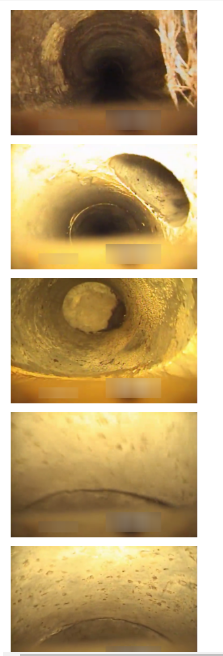
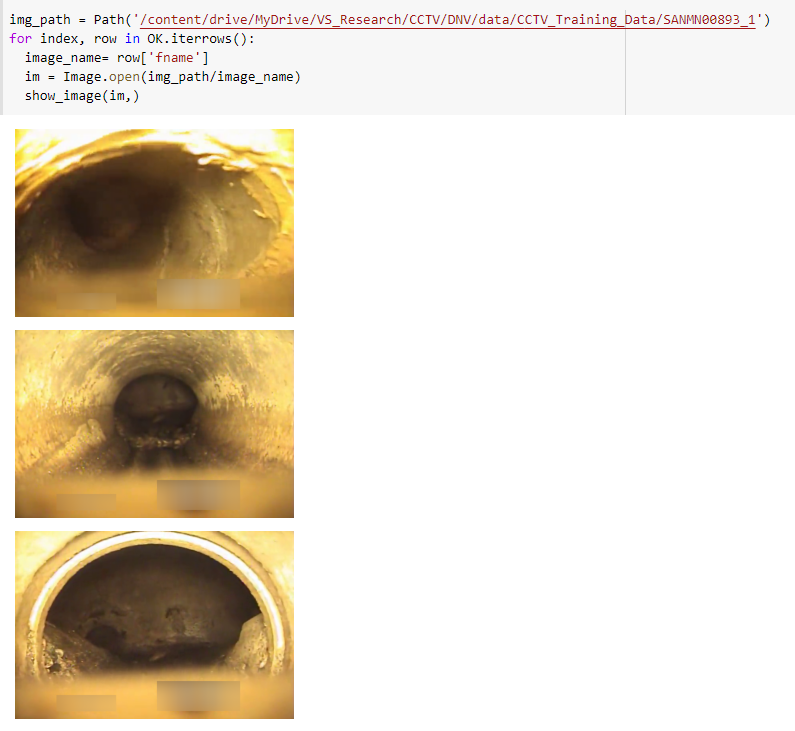
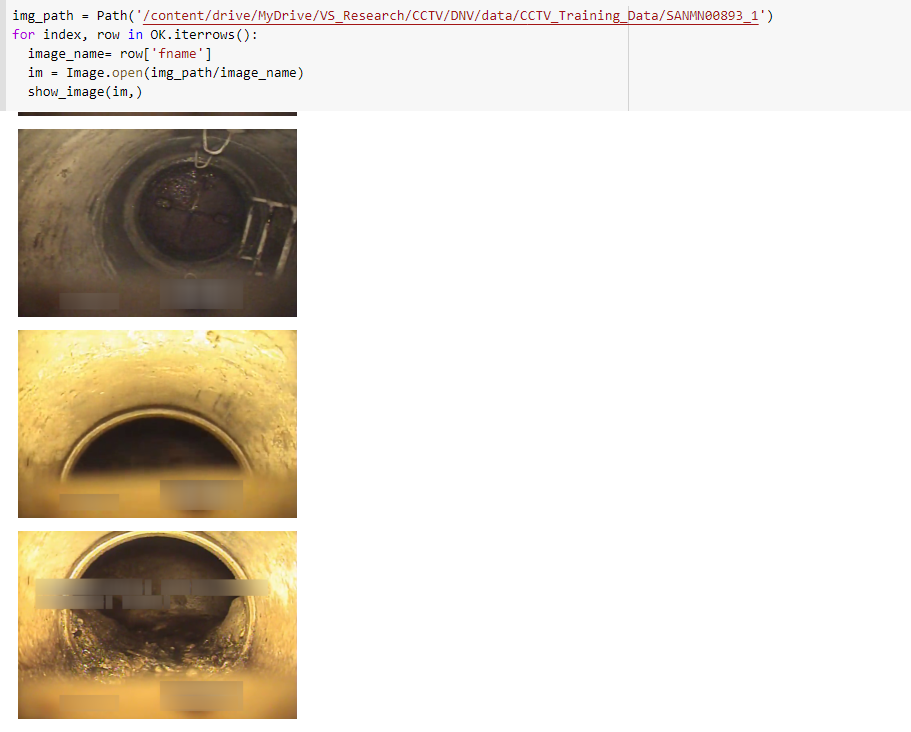
- 14 images were identified as OK (Connection with construction change). The first image that was identified OK is the image of inside of the tap break-in pipe. The rest are the images captured when the instrument was approaching the downstream manhole or inside the downstream manhole.
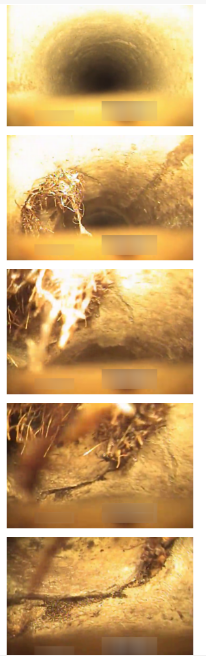
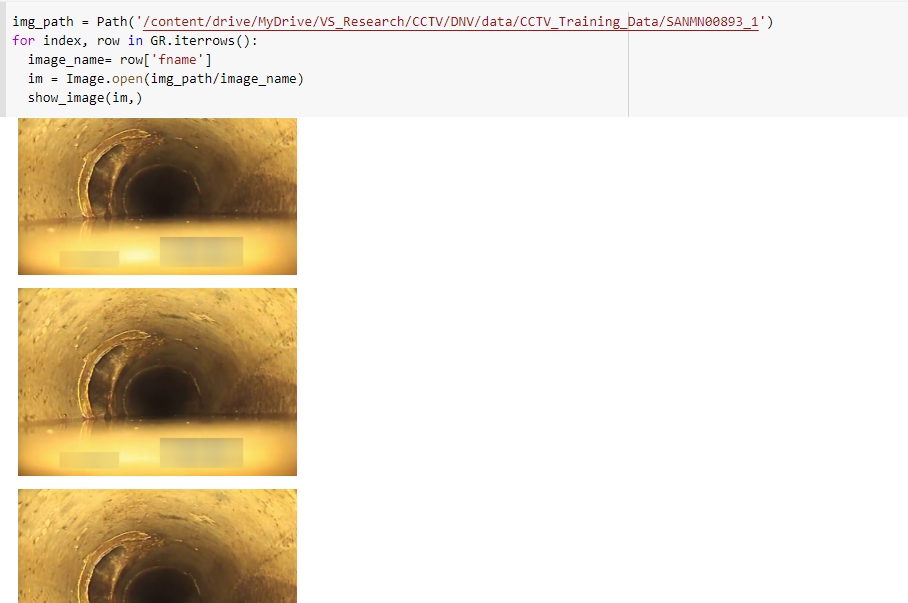
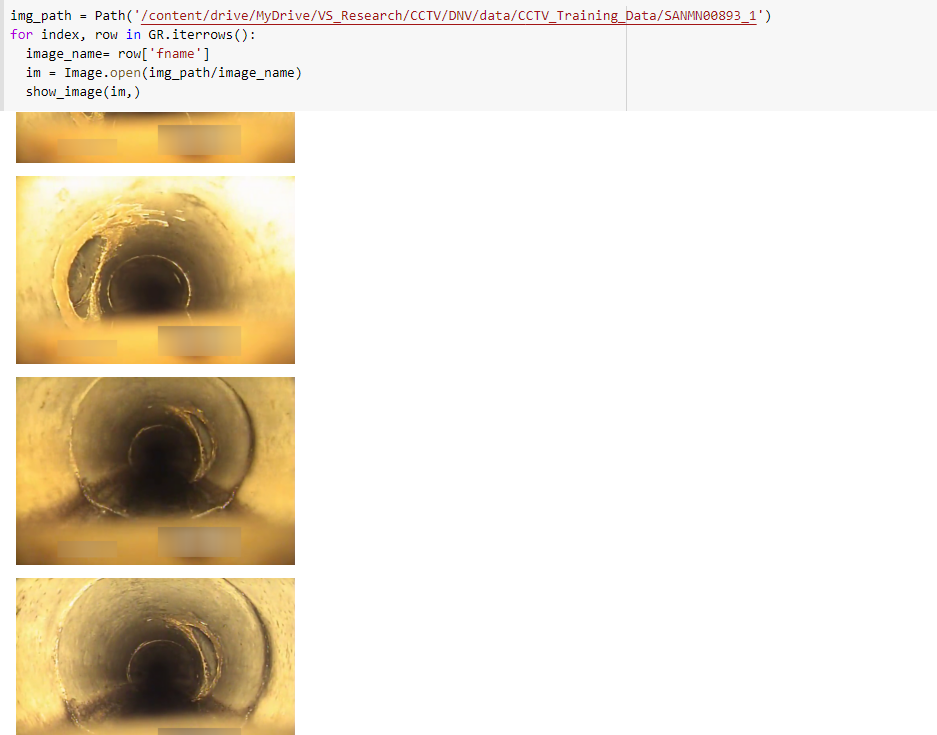
- 61 images were identified as GR (Branch pipe). 61 images were labeled either as TB (Tap break-in/hammer) or TBB (Tap break-in Abandoned) in the Access database.
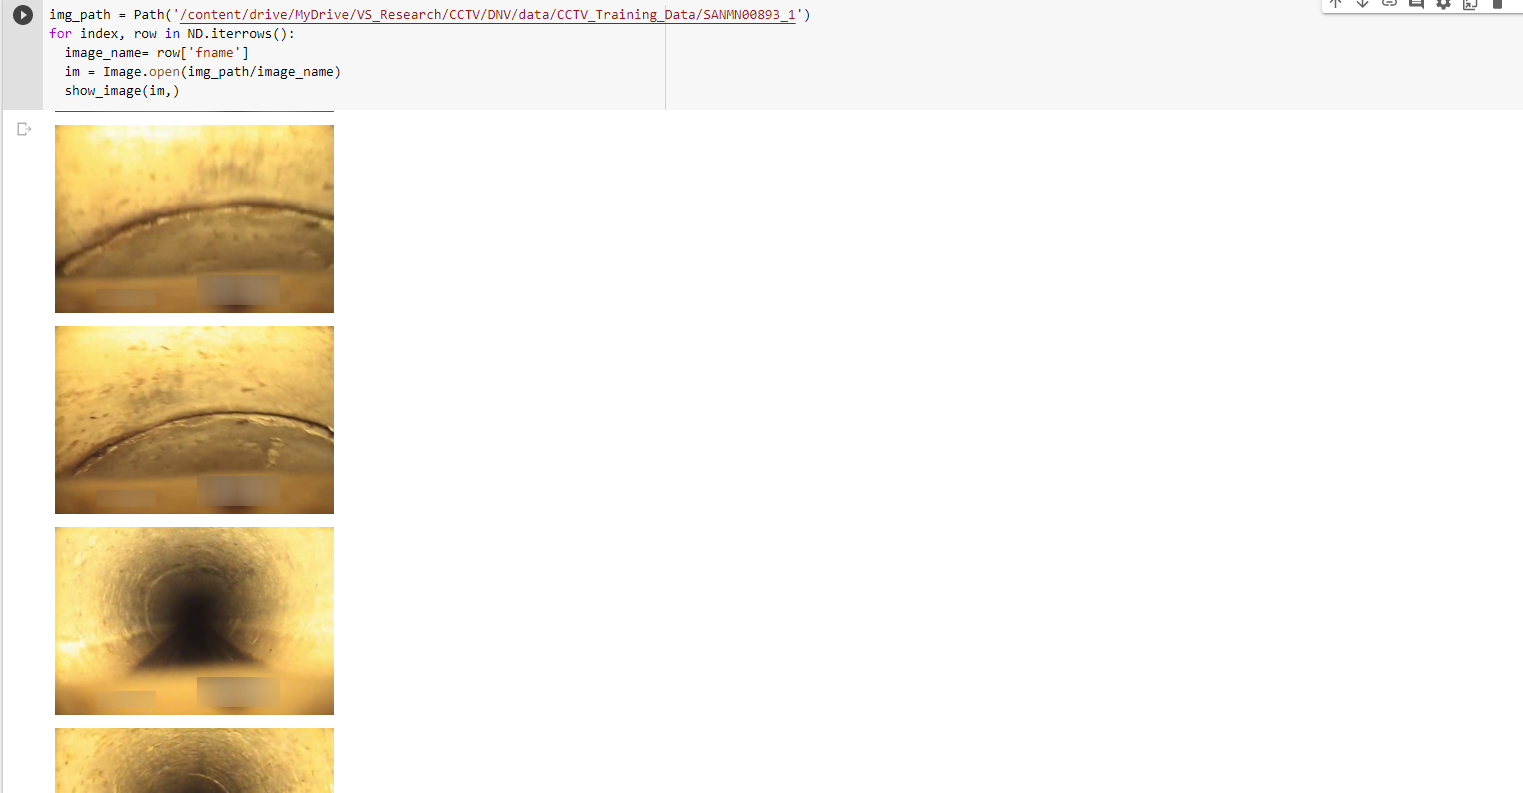
- 9 images were identified as ND (non defect).
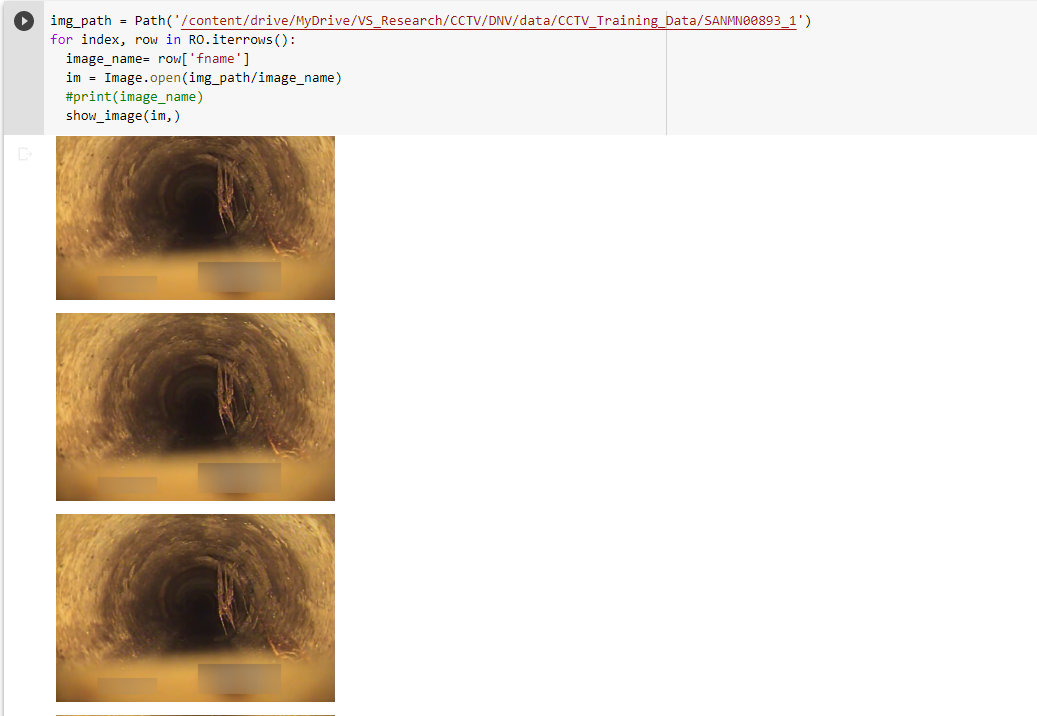
- 158 images were identified correctly as RO (Roots).
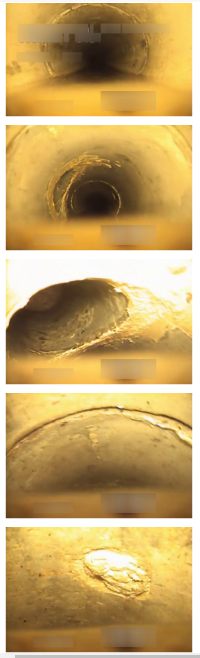
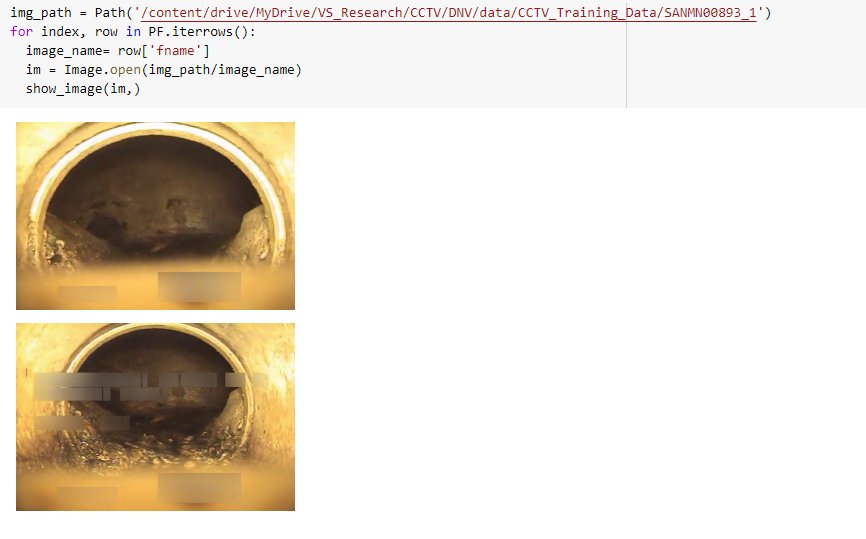
- 2 images were identified as PF (production error). DNV labeled these images as AMH (Access Point Manhole). Note: The similar images to these 2 images were identified as OK and not PF.
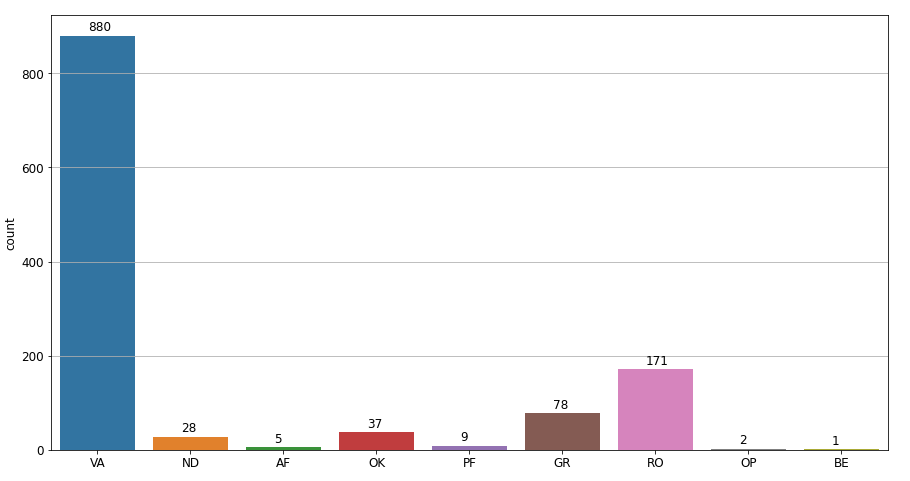
Predicted label distribution when threshold is set to 0.4
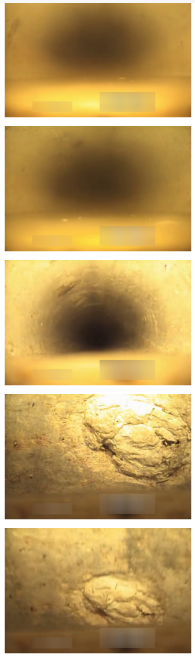
- 19 images had no label. Sample images:
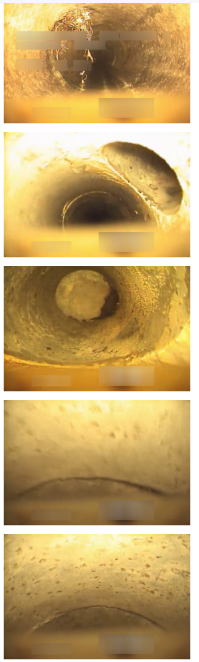
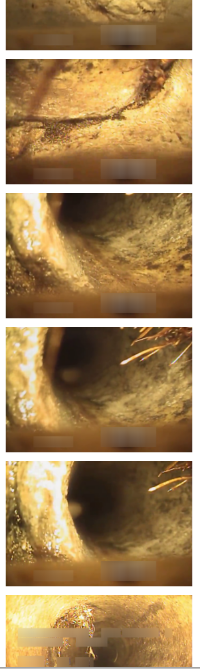
171 images were correctly identified as RO.
More images were identified as ND. However, some images were identified incorrectly
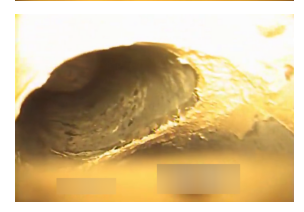
78 images were correctly identified as GR.
1 image was identified as BE (Attached deposits).This image was also identified as GR (correct) and VA (incorrect)
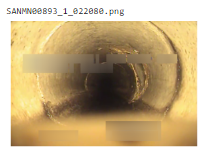
2 images were identified as OP (Connection with transition profile). Each image contains the tap and roots at 1 o'clock. However the roots were failed to be identified as these 2 images were only labelled as OP (not sure) and VA (incorrect).
Predicted label distribution when threshold is set to 0.3
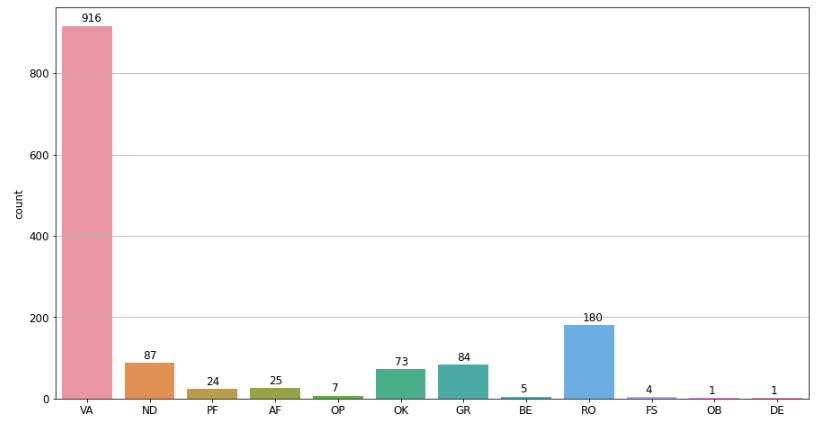
- After reducing threshold to 0.3, each image has at least one label.
Conclusions
- The model performs well when identifying images with roots and taps. The model does not perform well labelling images as ND. Only 87 out of 1008 were identified as ND when prediction threshold is reduced to 0.3, with some of images were labeled incorrectly. 916 out of 1008 were labeled as VA when prediction threshold is reduced to 0.3, with some of images were labeled incorrectly. One observation I made is at the bottom of most images are foggy. The model might mistake it for the water level.