Brian has increased my simulation time. However, the simulation still ends around 0.35 day due to the error caused by the bioreactor block. If we used the first version of the bioreactor block (the results we got on grafana), the Salk and Snh values wouldn't go to 1e37, and the model could run for a more extended end day. However, other variables, such as So, Xs..etc., will be incorrect. So the bioreactor will have to be fixed first.
I have created 10 random sets of 2 videos that will be set aside for testing out of 72 videos. I submitted 5 jobs to Compute Canada, and all jobs have been finished. I will run the prediction on the test dataset and upload the results to the people website.
I will implement the continuous defect and use the access database for image labelling. I will submit the 5 jobs with the same videos corresponding to the 5 jobs in point 2 to compute Canada by tonight and compare the prediction results with the models created in point 2.
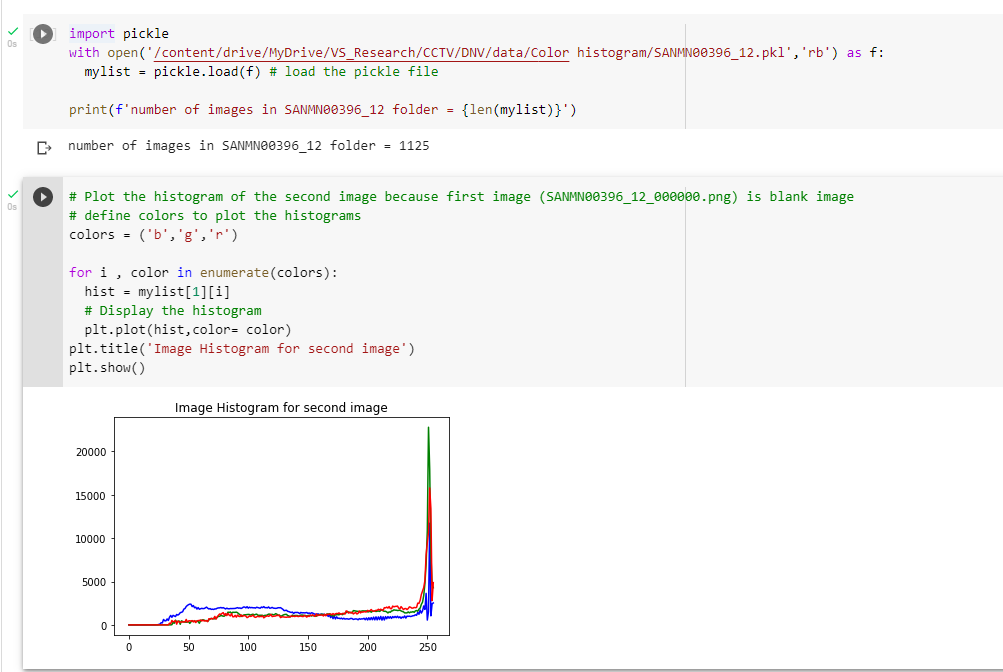
I have stored the histogram values of each image in the pickle file. Go to this link
When you load the pkl file, such as SANMN00396_12.pkl, you will get a list of histogram values of image frames in the SANMN00396_12 folder.
The length of the list is equal to the number of images in the SANMN00396_12. Each image contains three arrays storing a histogram of the image's blue, green, and red channels. I sorted the list of images in alphabetical order before calculating the histogram. Therefore, the index 0 should be a histogram of SANMN00396_12_000000.png.
Here is an example of how to plot the image's blue, green, and red histogram.
Did a small experiment where xtemp output from Matlab was imported to Collimator and read directly as input to calculate for the reaction rate. There are still some differences between Matlab and Collimator state variable outputs.
The value of Si are the same in Matlab and Collimator
The graph of Ss matlab and collimator values follow the same shape. However, the outputs from collimator are higher
The values of So are around 0.006 to 0.014 in matlab while So in collimator have negative values.
have a pipe line with sharpen image and with two videos set aside