Satellite Imagery and HAB in 3D
Final Design and Notes
Download Raster Imagery from Copernicus Browser
- Navigate to the Copernicus Browser Website
- Create an account and log in, or continue as anonymous.
- In the top-right corner, use the
Go to Placesearch box to zoom to your desired location. You can type something likeCity, STATEbut since this app is based in the EU, the results might not look like you expect. For example, typingToledo, OHwill result in the first dropdown option beingToledo, United States of America. If you click on this first result, it will be the correct Toledo, even though you don't see the state name. - In the left side menu under
CONFIGURATIONS, click the dropdown and selectOcean and Water Bodies. - In the left side menu under
DATA COLLECTIONS, stay with the default Sentinel 2 and selectSentinel-2 L2A. Note: I'm not sure what the practical difference is between L2A and L1C. - At the top left of the side menu, click on the
YYYY-MM-DDand use the resulting date picker to go to the date of interest.- After selecting the initial date, you can use the arrows next to
YYYY-MM-DDto quickly move to the next or previous date with acceptable cloud coverage. - You can change the acceptable cloud coverage, but the default 30% works.
- This value decides which days to ignore. Cloudy days make for bad satellite imagery.
- After selecting the initial date, you can use the arrows next to
- After you've selected all the previous configuration options, you can zoom in further to the area of interest.
- In the left menu under
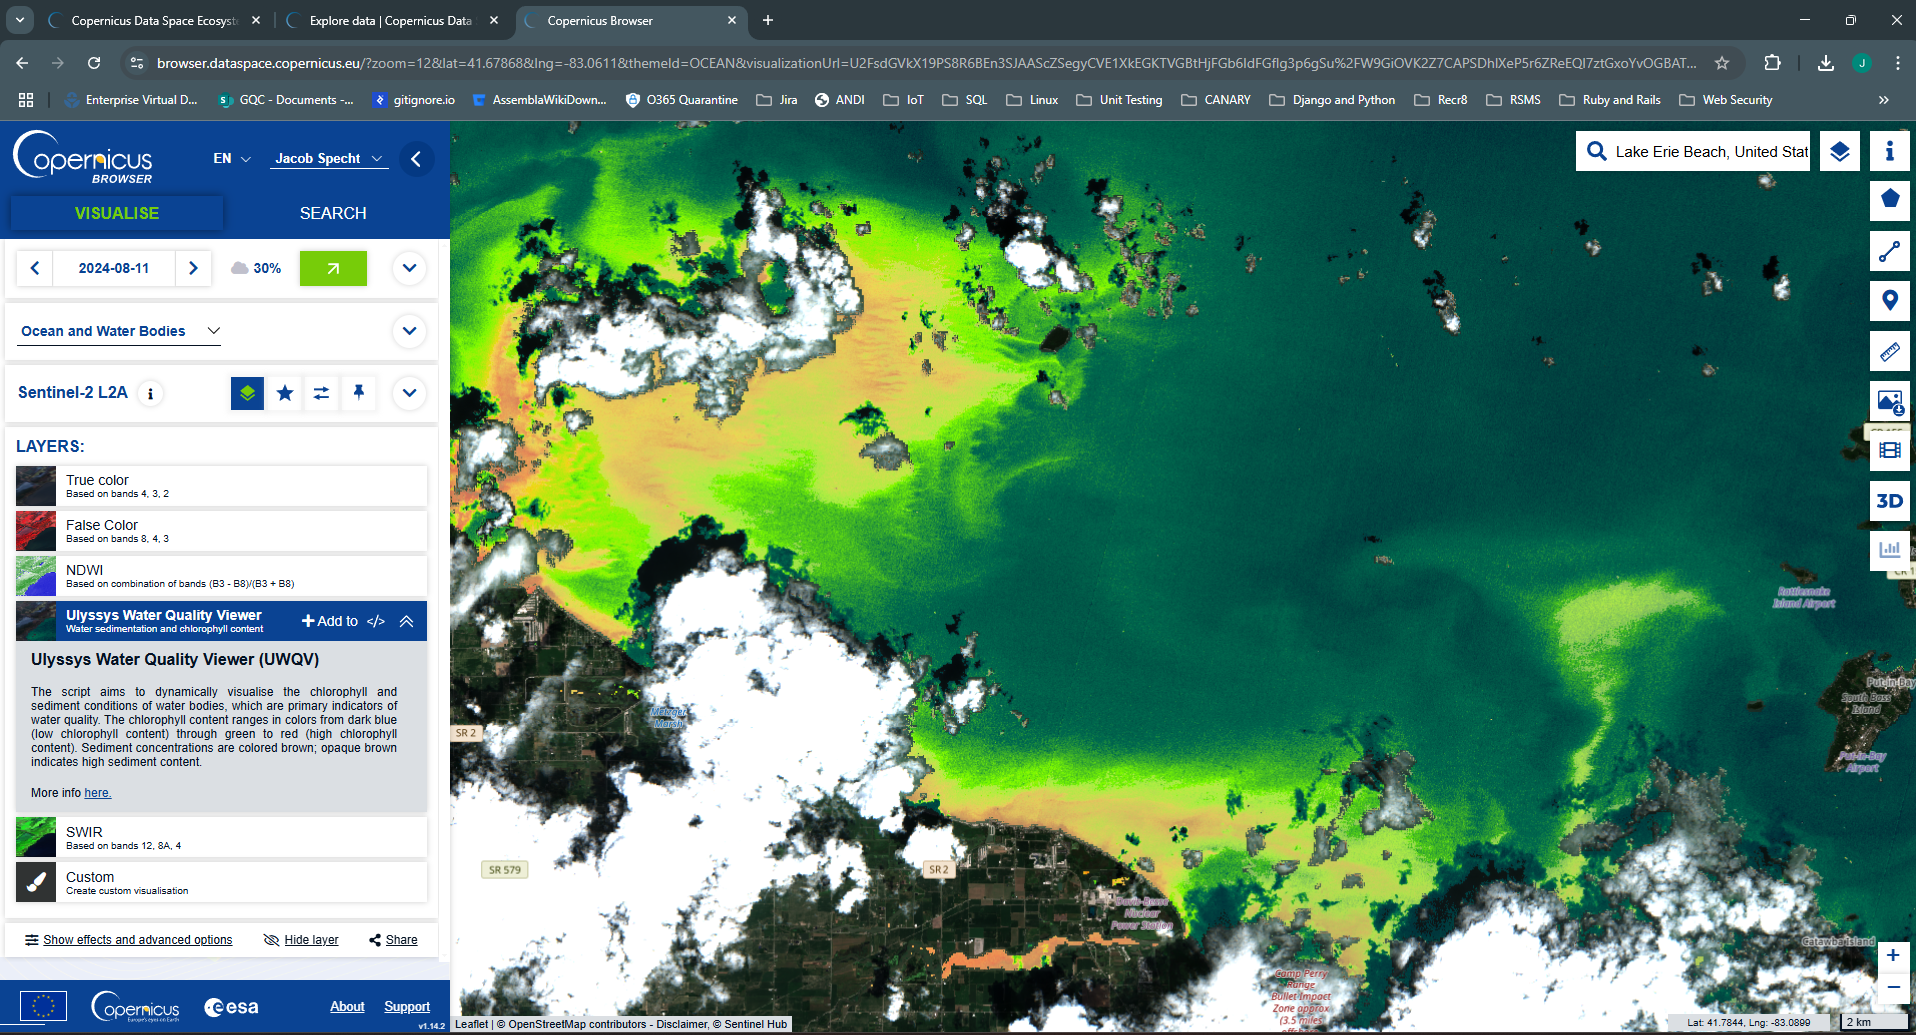
LAYERSselectUlyssys Water Quality Viewerwhich can be used to colorize the satellite imagery for Water Quality.- This custom script colorizes based on
Total Suspended Solids (TSS)andChlorophyll (CHL)to get an aggregate view of water quality. - After selecting the layer, you can modify its parameters by clicking on
the
</>button which opens an in-browser code editor. - Here, you can turn off
TSSto get aChlorophyllonly view by changing thetssIndex: 'default',line to instead betssIndex: null,. - Still in the code editor, scroll down to the bottom of the PARAMS section
(around line 17) and change the line
background: 'default',tobackground: [255, 255, 255],. This sets the "background", or land pixels to render as pure white instead of rendering the actual satellite view.- This is useful for trimming land and getting a TIFF of water only.
- This custom script colorizes based on
- When exporting the layer to a GeoTIFF file, you can either export your current view, or you can define a viewbox using a square or draw a polygon.
- On the far right side of the map, select the fourth from the bottom icon
showing an image with a download arrow.
- Change the tab to
Analytical - Change the Image format to
TIFF (32-bit float) - Change the Image resolution to
HIGH - Leave everything else default, scroll down, and click
Download
- Change the tab to
Trim Raster GeoTIFF File with QGIS
We can trim certain parts of a GeoTIFF using QGIS. Before this step, however, you should first download from the browser. Also, make sure that the content you want to trim (i.e. land pixels or background layer in the water quality example) are rendered as a single solid color, white for simplicity.
- Open QGIS
- Select
Layer > Add Layer > Add Raster Layerand navigate to your downloaded TIFF. - Right click the newly added layer and select
Properties. - Go to the
Transparencytab. - In
Custom Transparency Optionssection, click the green plus (+) sign. - Click on the newly created row and change the Red, Green, and Blue values to
each be
255. - Leave the Percent Transparent at the default 100 and click Apply/OK. Note: You can add the OpenStreetMap layer beneath the raster to verify that the white pixels have disappeared.
- Right click the layer and select
Export > Save as. - For
Output modeselect the second radioRendered image. - Fill in the filename and path, then click OK.
At this point, you will have a trimmed TIFF raster file. You can upload this to Cesium Ion and use it in any of our Cesium-enabled React apps.
Satellite Imagery in ESRI
I found this ESRI video which discusses some of the data sources available.
At 36:45 they show how to bring in GeoTIFF Data from "local files", however it's "Local Files - via hosted TIle Service"
NOTE: There was an image here, but it got corrupted and is causing errors, so I just removed the image complete. The subtext was "esri geotiff local files via tile service"
They also allow "External Online Source - via Cloud Optimized GeoTIFF (COG)" as shown in this screenshot:
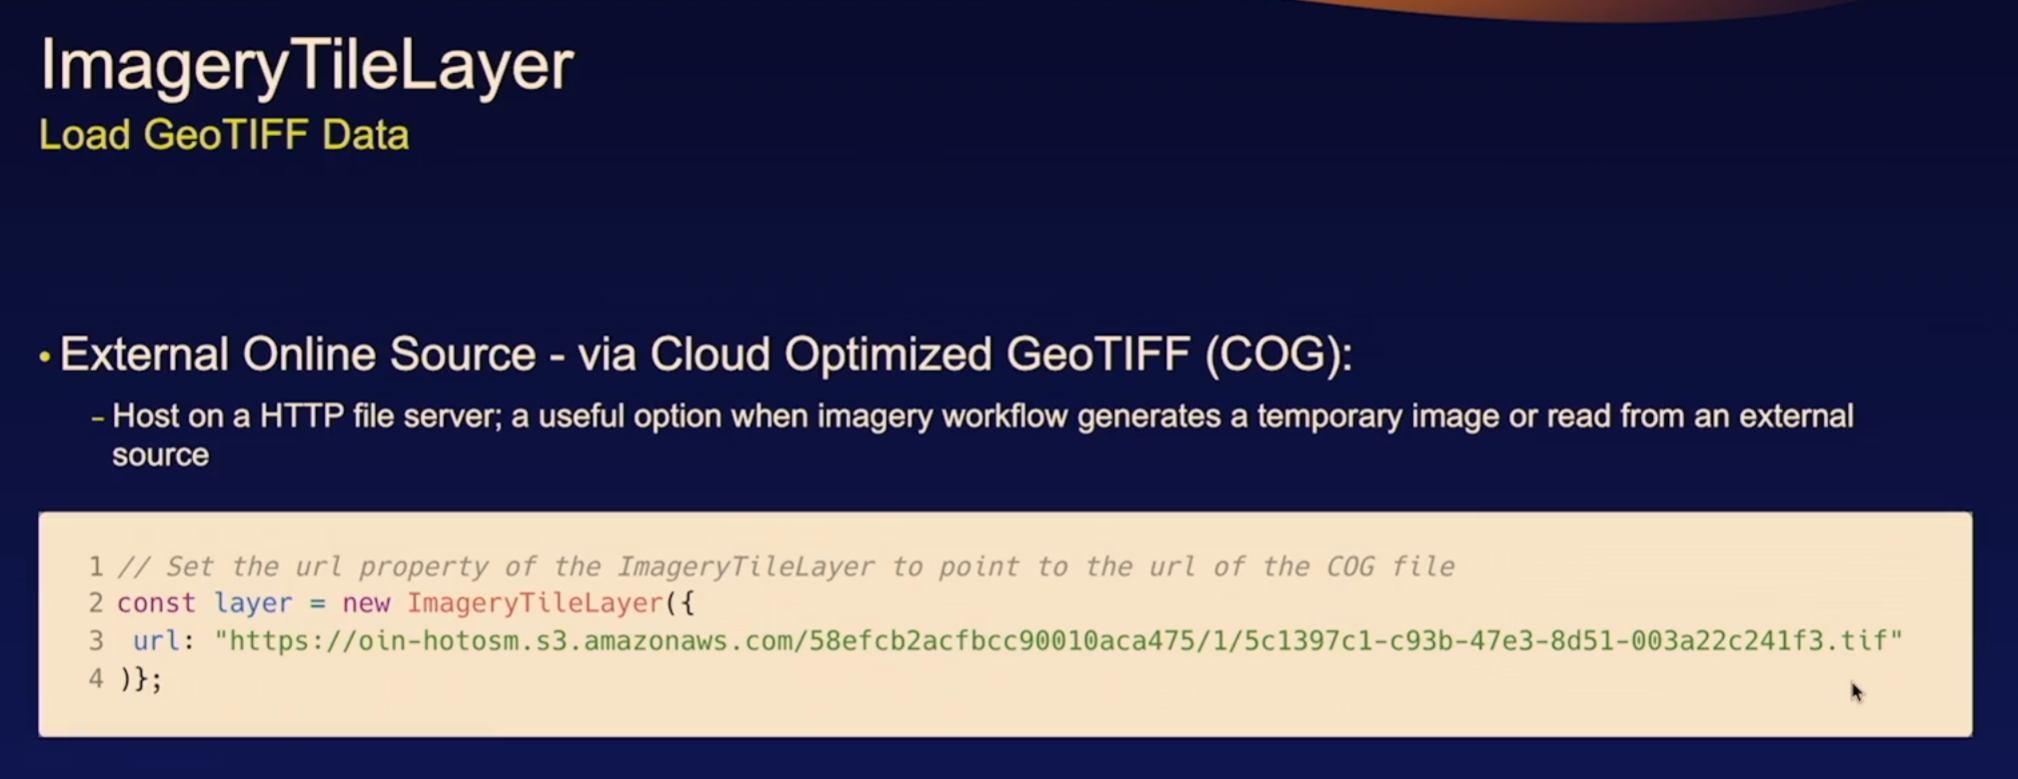
This external online source is probably what we want. We should be able to load
the tif file from the SWA's static content directory.
Satellite Imagery in Cesium
https://cesium.com/learn/3d-tiling/ion-tile-imagery/
HAB's
I couldn't find anything for Harsha Lake, but Erie has more promising results:
NOAA Coastal Science HABs Site
Cyanobacteria Algal Bloom from Satellite in Western Lake Erie Basin
All of these that I've found are the "latest" available data, not necessarily historical or unique events.
I will still grab one of the geotiffs to render.
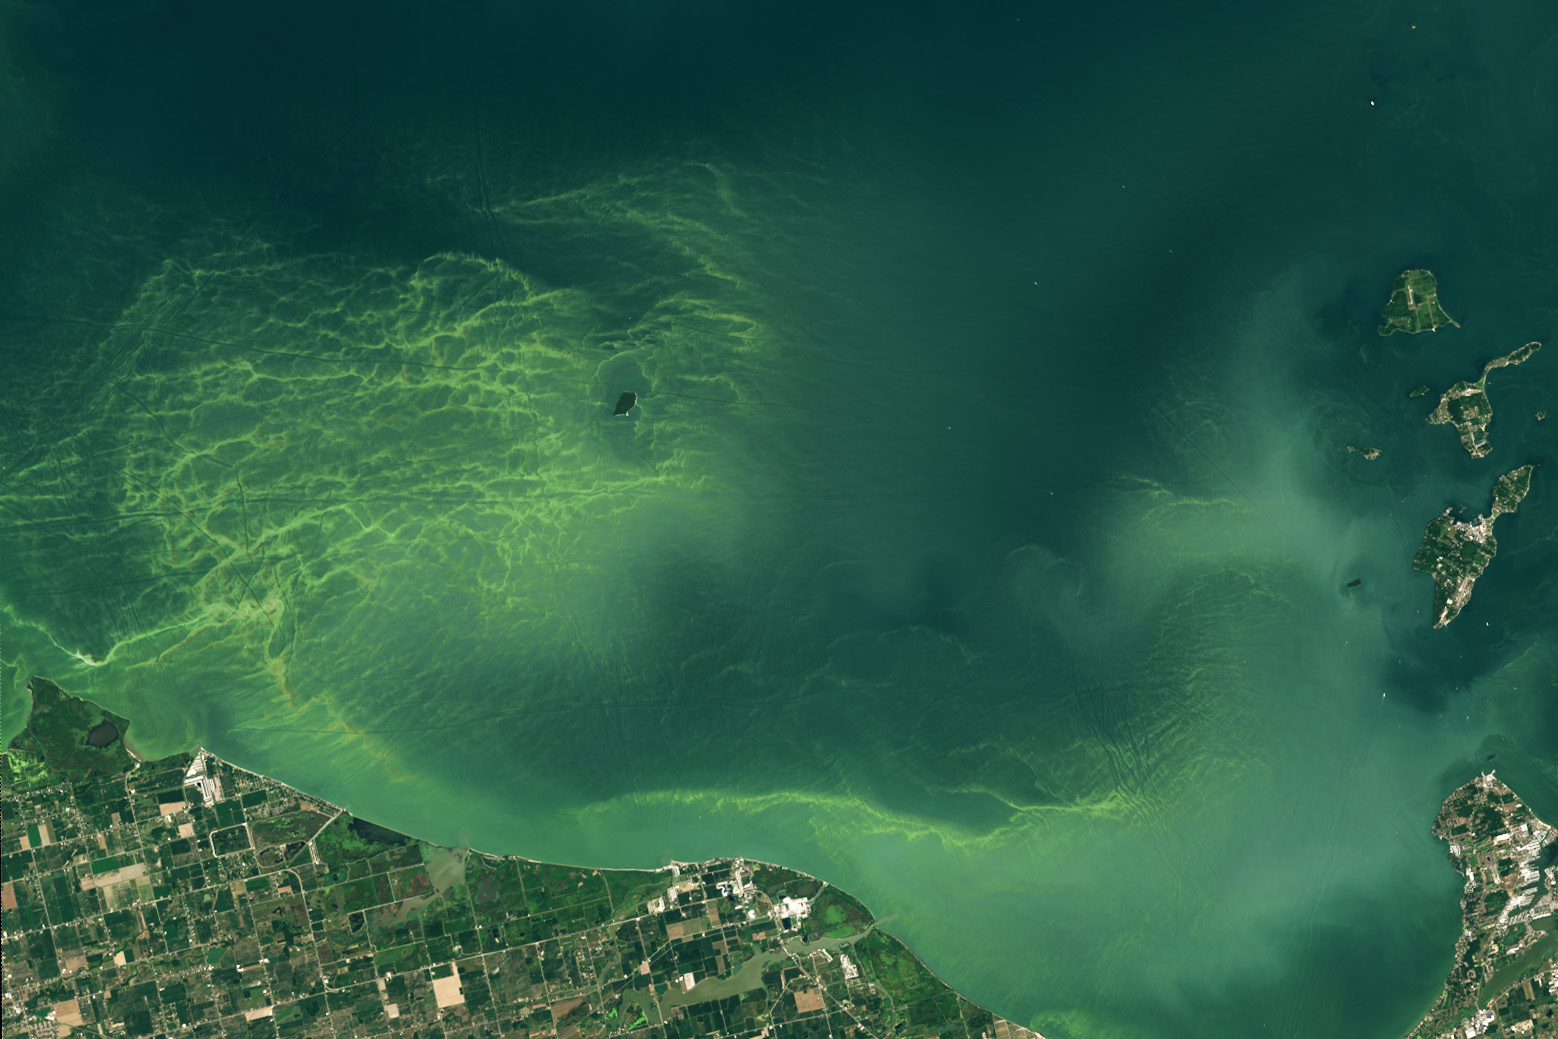
HAB Event on Lake Erie
Lake Erie Blooms - August 2024
Copernicus Browser Findings
I was able to find a rough approximation of the August 2024 HAB from the previous section in the Copernicus Browser:
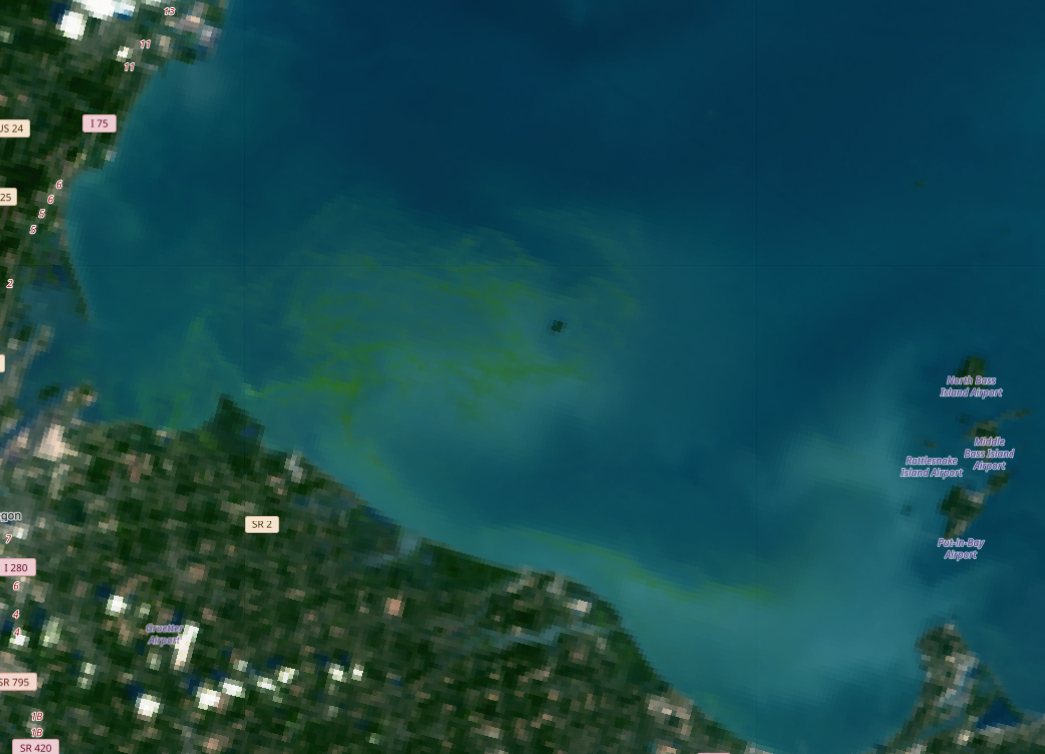
This was found in Sentinel 3 from the dropdown, then Sentinel-3 OLCI L1B with Enhanced Natural Color layer selected.
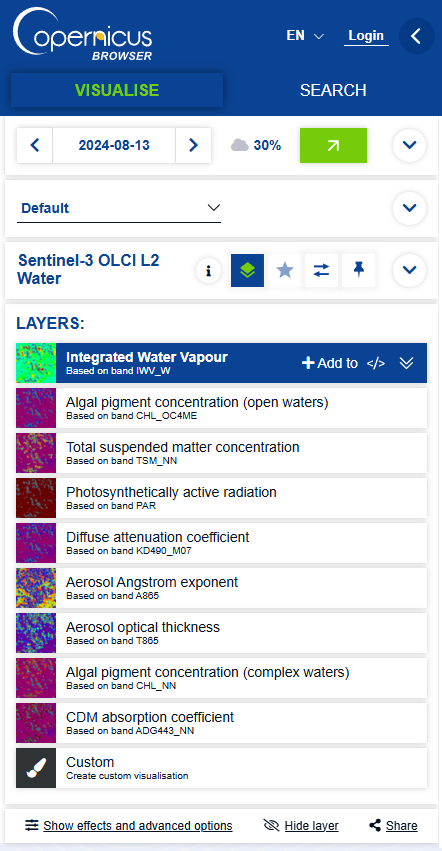
The Sentinel-3 OLCI L2 Water collection of data has some more interesting layers to play with, but they're color ramp overlays of the radiation data from the satellite's sensors, as opposed to a realistic view from the sky.
We could probably use the OLCI L2 Water collection for some good visualization of HAB. They include some interesting layer options:
We might be able to make the land transparent using this information:
Transparent Tif Images with GDAL and QGIS
Ask Community for Help Exporting
I am using Ulyssys Water Quality Viewer script in Copernicus Browser to visualize water quality from satellite data. I want to export the resulting images as geotiff for use in a 3D data viewer (Cesium). I can do this well enough. However, I would like to trim off the non-water pixels. I've tried modifying the opacity for non-water pixels, but that just makes the base satellite imagery show up. Is there a way to export the geotiff with non-water pixels completely transparent, effectively trimming so only the water is exported? I've found a stack exchange post that I think is describing how to do what I want from QGIS and with GDAL, but I'm curious if it can be done at the time of image export.
Ulyssys Water Quality Viewer
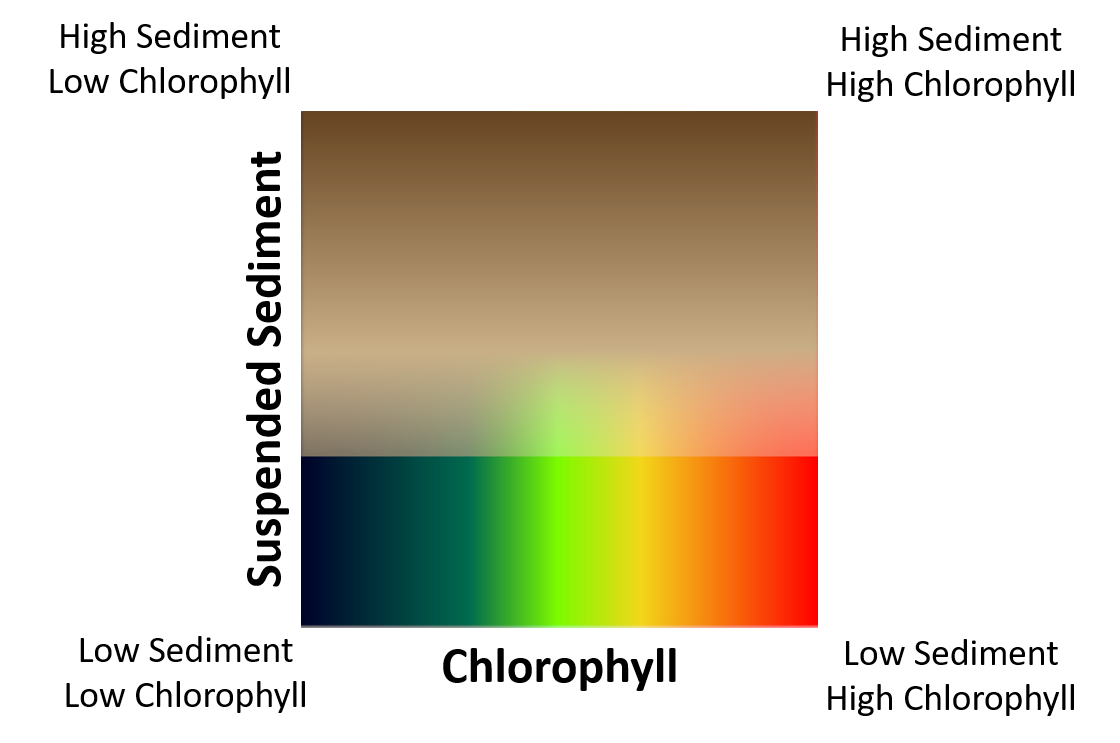
The script aims to dynamically visualise the chlorophyll and sediment conditions of water bodies, which are primary indicators of water quality. The chlorophyll content ranges in colors from dark blue (low chlorophyll content) through green to red (high chlorophyll content). Sediment concentrations are colored brown; opaque brown indicates high sediment content.
This is a potentially interesting view.
Issues Rendering Tiles in Copernicus Browser
Sometimes, the tiles won't load properly and I simply can't see the data. This seems to happen mainly in the Sentinel-2 data, however I also think Sentinel-2 might have better resolution than Sentinel-3.